Multi-Billion Household Products Company
Company executives set a long-term goal to triple sales in the lighting. To do that with their current fulfillment processes would require an additional $30 to $100 million dollars in finished goods inventory and another million square feet in warehousing space. That was unacceptable.
One of the company’s best-selling products in this segment is a light for boating and emergency situations. Marketed for hurricane preparation in the spring and summer, demand followed a somewhat seasonal pattern. But despite having an efficient production process, they were only achieving three inventory turns per year.
The problem was in the distribution network. The company stored several months of inventory in four regional distribution centers, plus two additional hurricane warehouse locations. One of its largest retail customers, which accounted for over 50% of the sales volume for the product, also had warehouses all over the country and its own dedicated facilities for hurricane-related items. It was carrying 13 weeks of inventory as well. To improve the flow of goods through this extended value chain, the company engaged TBM Consulting Group. TBM pulled together a cross-departmental team to take a closer look at customer demand and come up with a better inventory management strategy.
As illustrated in the chart below, inventory and sales trends were never aligned. Inventory levels never fell below 500,000 units even in the worst hurricane season.
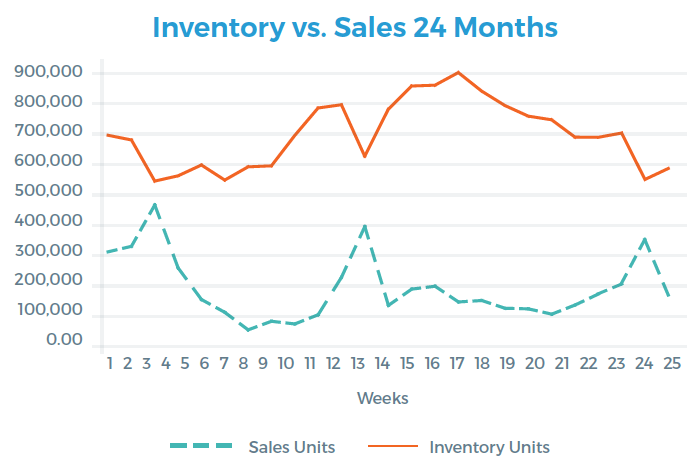
One of the big “Aha” moments for the team came when they overlaid four data elements:
A detailed inventory analysis revealed that actual customer demand at the retail level over the course of the year was fairly stable. The manufacturer was building additional inventory to accommodate fluctuations in shipments caused by special tax-holiday shopping events and in advance of the oncoming storm season. They also realized that it was unnecessary to hold anywhere near the amount of inventory that they had been targeting.
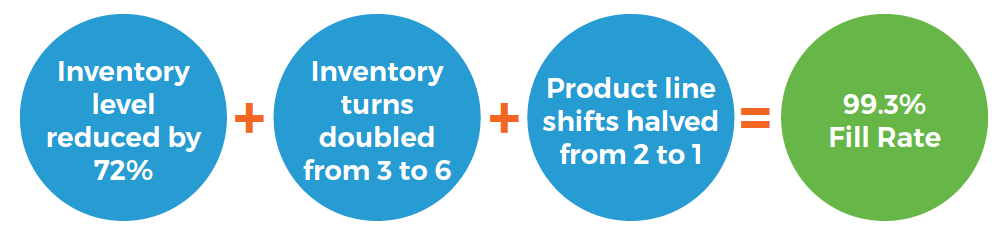
To determine more appropriate inventory levels the team developed a simulation tool that allowed managers to test different inventory levels with each SKU. The initial phase of the plan yielded the following results.